June 03, 2024
The Power of People Near Protected Bikelanes
In celebration of #WorldBicycleDay, ITDP is delving into what it means to measure People Near Protected Bikelanes as part of a series on the indicators in our Atlas of Sustainable City Transport. Read more about the indicator People Safe from Highways and its impacts.
Visit ITDP’s Atlas of Sustainable City Transport here.
For years, cities and governments have focused on length or number of kilometers as a measure of how comprehensive or impactful their cycling infrastructure is. With the debut of the Atlas of Sustainable City Transport, ITDP suggests that viewpoint is outdated. Rather, we have the data to show that it’s not just how many kilometers of lanes that makes the most impact—it’s also where the lanes are built. With the Atlas’ dashboard, ITDP offers every city in the world a more modern and more meaningful way of measuring progress through the indicator of People Near Protected Bikelanes.
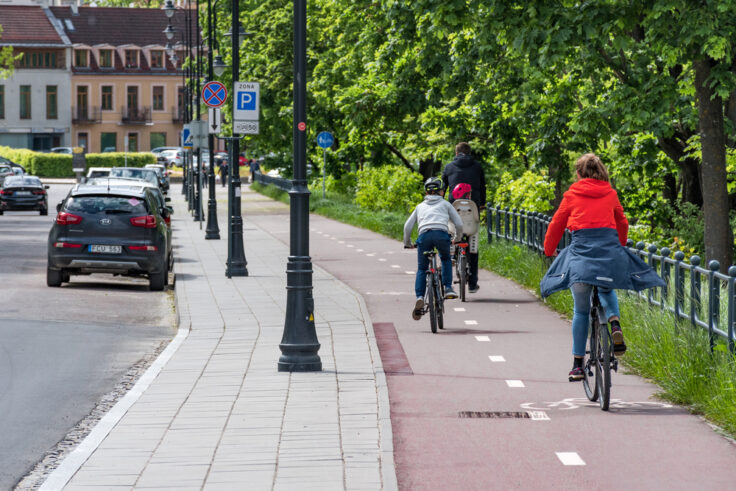
This indicator quantifies the percentage of city residents living within a comfortable walking distance of physically separated bike lanes. This metric offers valuable insight into the actual accessibility and coverage of cycling infrastructure within urban neighborhoods. Protected bike lanes are particularly important because they provide cyclists a dedicated space separated from motor vehicles by physical barriers, enhancing perceptions of both safety and access. The effectiveness of protected lanes extends beyond their physical boundaries — they are also an important part of safer pedestrian and transit zones on streets that are critical to encouraging more people to cycle.
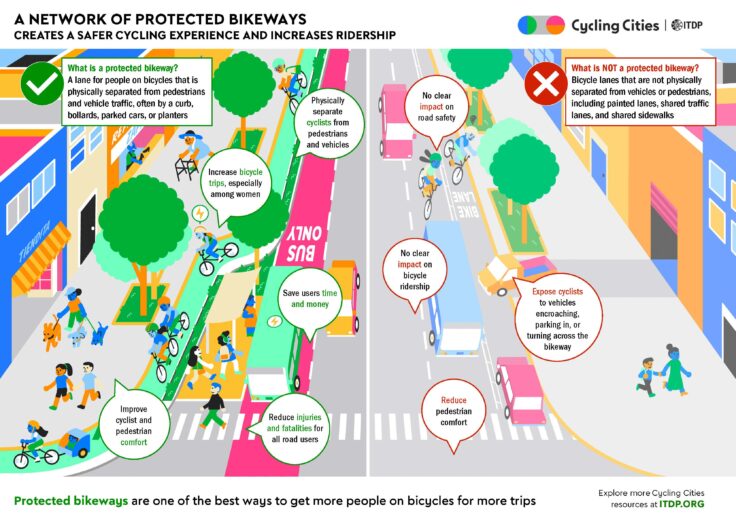
People Near Protected Bikelanes ultimately helps to demonstrate that encouraging a shift to cycling for more trips is not just about the quantity of bike lanes in an area, but the quality and proximity to where people actually live and work. By prioritizing the creation of protected lanes closer to residential, commercial, and transit-oriented areas, cities can foster environments that make cycling a safer and more convenient mode of transport — especially as an alternative to short trips made by car. In addition, because cities often prioritize the return on investment of public projects, understanding People Near Protected Bikelanes can provide more awareness of the true impacts of cycling networks for communities.
Watch this video to learn more about updating the data in OpenStreetMap.
How is People Near Protected Bikelanes Calculated?
People Near Protected Bikelanes divides the number of people living within 300 meters of a protected bike lane by the total population, resulting in the percentage of people who have reasonable access to protected lanes. ITDP defines physically protected bike lanes as either cycle paths completely separate from streets for vehicles (such as off-street trails) or streets with bike lanes that are physically protected by a curb, bollards, or other materials that prevent vehicle encroachment.
The Atlas also displays People Near All Bikelanes, or the percentage of people living near any bike lane whether protected or unprotected. Unprotected bike lanes are separated from vehicular traffic solely by painted lines. Calculating People Near Protected Bikelanes requires two key sources of open data — the European Commission’s Global Human Settlement Layer (for population data) and OpenStreetMap (for the location and type of bike lanes). A great advantage of most open data sources is that anyone can contribute to them, provide suggestions, and correct inaccuracies.
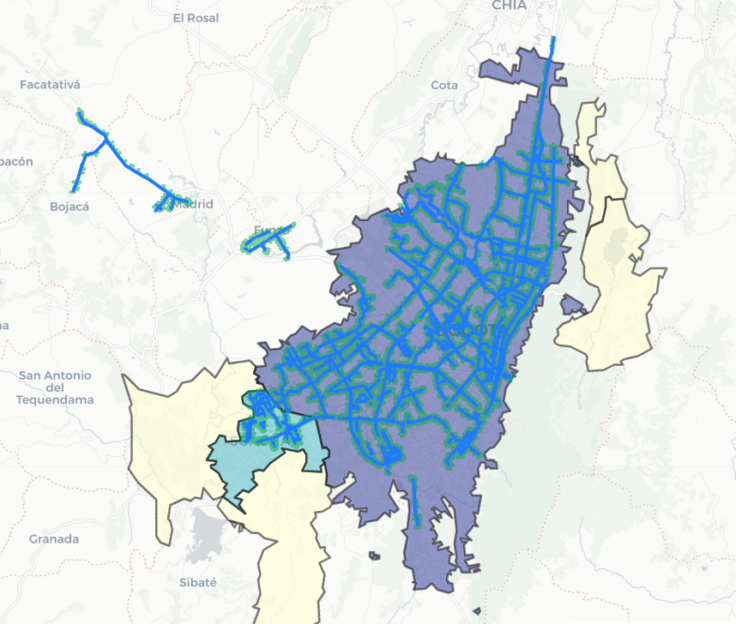
In Bogotá, Colombia, 51% of residents live within a 300m walk of a protected bike lane (left). In Medellín, Colombia, 20% of residents live within a 300m walk of a protected bike lane (right).

People Near Protected Bikelanes is a high-level measure of how effectively cities integrate land use and active mobility. Unlike traditional metrics cities might use to track and report on cycling, like kilometers of bike lanes or cyclist counts on individual corridors, People Near Protected Bikelanes delves into the heart of the matter — how accessible safe cycle lanes are by people. A 10 kilometer protected bike lane that runs through a dense neighborhood likely serves more people than a 10 kilometer lane in a low-density industrial area. Infrastructure that does not connect places where people live with places they want to go will be used far less often, and deliver fewer network benefits.
People Near Protected Bikelanes correlates strongly with nuanced measures of access-to-destinations. This indicator can also be predictive of ridership as a result of more safe, comfortable lanes. For example, in a sample of eight Latin American cities, People Near Protected Bikelanes explains 88% of the variation in bicycle ridership. Statistically speaking, this is a significant number showing a high level of correlation between people living near protected bike lanes and bike ridership in a city.
Comparing Access with People Near Protected Bikelanes
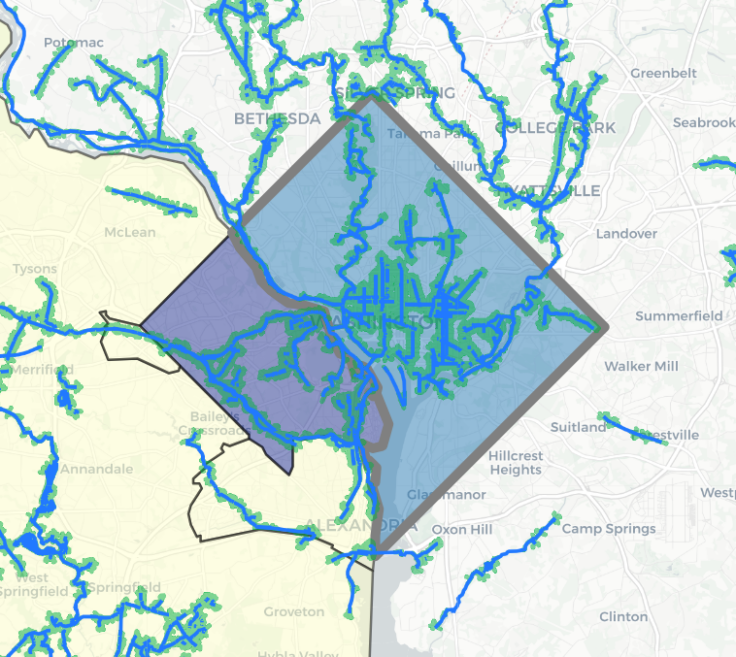
To understand the impact of People Near Protected Bikelanes, we can examine two cities as examples: Washington, DC in the U.S. and Seville in Spain. Both cities have roughly the same population size and density, and have 174 kilometers of protected bike lanes according to the data in the Atlas. Despite these similarities, about 1 in 3 people in Washington, DC live near a protected bike lane (32%) compared to around 3 in 4 people in Seville (73%). Since the early 2000s, Seville has made a concerted effort to build a citywide connected, protected bike lane network and improve connections to public transit. In just two years, Seville built a network of 77 km of protected bicycle lanes that connected most major neighborhoods, with 43 additional protected lanes added in subsequent years.
Comparing bikelane networks in Washington, DC (left) and Seville, Spain (right) within the Atlas.
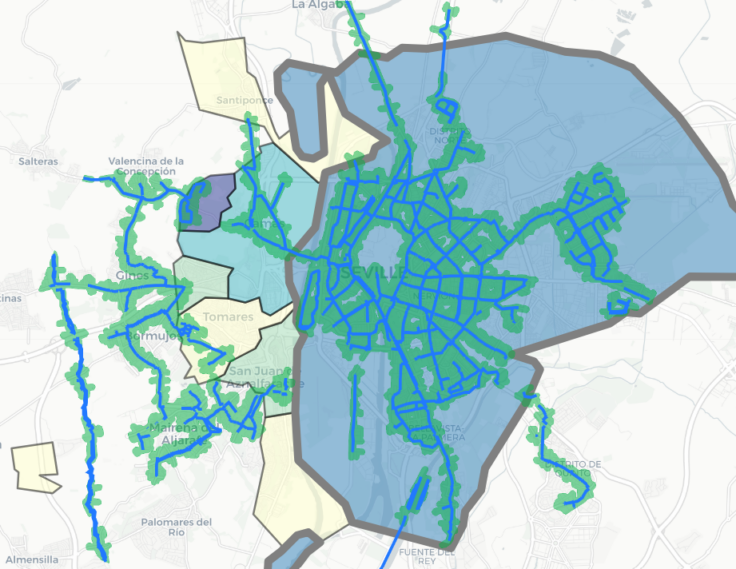
Cyclist counts rose sharply from 330 per day in 2006, before the network was built, to nearly 2000 per day after. Bicycle mode share grew from 5% to almost 9% over the same period. Seville is an often-cited success story for cities to pilot bicycle lanes with quick-build designs and low-cost materials that are made permanent over time, as opposed to leaving cyclists exposed to vehicle traffic while individual plans and designs are approved. By expanding its bike infrastructure across diverse sections of the city where people live and work, the city reports over 70,000 daily bicycle trips—notably higher than the reported 52,000 daily ridership of the Seville Metro.
Conversely, Washington, DC built 100 miles (160 km) of bicycle lanes (protected and unprotected) over 20 years between 2002 and 2022. This network is not complete, often leaving cyclists to ride on unsafe, high-speed streets for at least a portion of their trip. The densest part of the network covers downtown and was built to support commute trips, but protected lanes dissipate in the northern and eastern residential neighborhoods of the city, with almost no infrastructure at all east of the Anacostia River in historically underserved, majority African-American neighborhoods. Bicycle mode share has grown from about 1% in 2004 to about 4% in 2018.
It is clear that People Near Protected Bikelanes is a powerful measurement of what bicycle infrastructure actually means for urban residents, and it should be integrated into every city’s transport planning. So, the next part of this blog series will delve deeper into the significance of the indicator using real-world examples from major cities like Los Angeles, USA; Bogotá, Colombia; Glasgow, Scotland; and Santiago, Chile—all members of ITDP’s Cycling Cities campaign.
This next piece will demonstrate how People Near Protected Bikelanes can be a crucial tool for guiding transport investments in areas where cycling infrastructure is not only necessary, but can also have the most impact for communities.
