August 06, 2024
Visualizing Urban Accessibility in Mexico and Beyond
As part of ITDP Mexico’s Ideamos program, which helped pilot several innovative mobility-related projects, a data-driven visualizer was developed to highlight access in cities across Mexico.
Read more about the pilots of the Ideamos program in the 2023 issue of the Sustainable Transport Magazine.
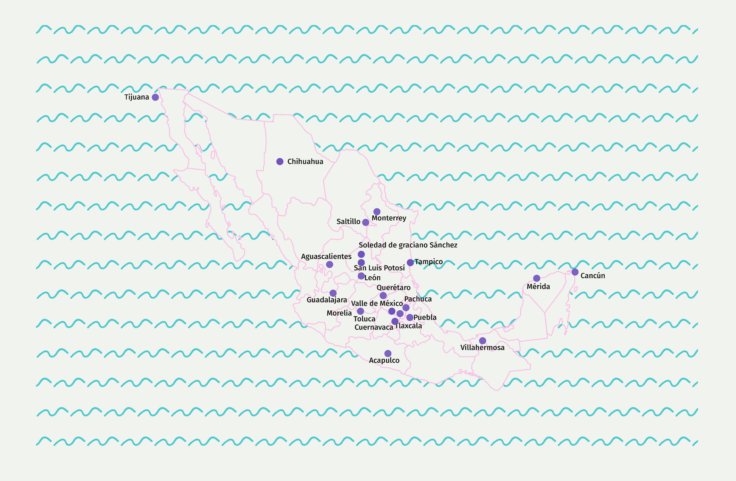
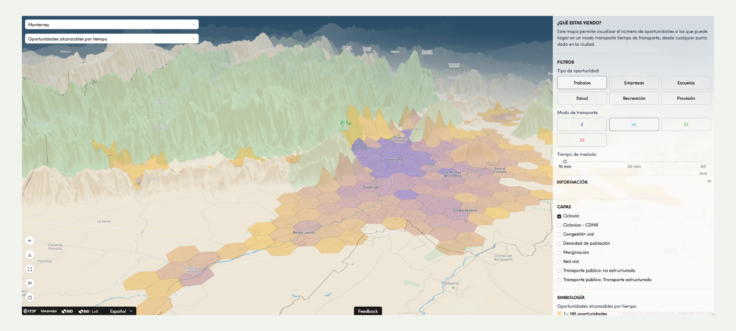
This Visualizador de Accesibilidad Urbana (Urban Accessibility Visualizer) serves as an interactive tool to facilitate the analysis of urban access in 20 key Mexican cities. It displays integrated information on urban transport in these regions and indicators related to access to jobs, schools, and healthcare according to travel time, costs, and the carbon emissions generated.
For each city, the platform provides several interactive visualizations, the level of urban accessibility by travel time, emissions and costs, as well as the level of local traffic congestion. Downloadable city data is also available for each visualization. The Visualizer’s goal is to provide an interactive interface for planners, policymakers, academics, and beyond to better understand urban access in Latin American cities in order to improve solutions for mobility.
For example, cities and transit agencies can identify areas with low accessibility and find opportunities to improve public transport connections for various types of communities. Transport network companies (services that provide on-demand transportation, like rideshare or bikeshare) can explore areas with limited or low mobility access so they can expand services to new customer segments. Researchers and everyday citizens can learn about general accessibility measures and assess housing, healthcare, or commercial opportunities based on access and transport times and costs.


Recent Updates
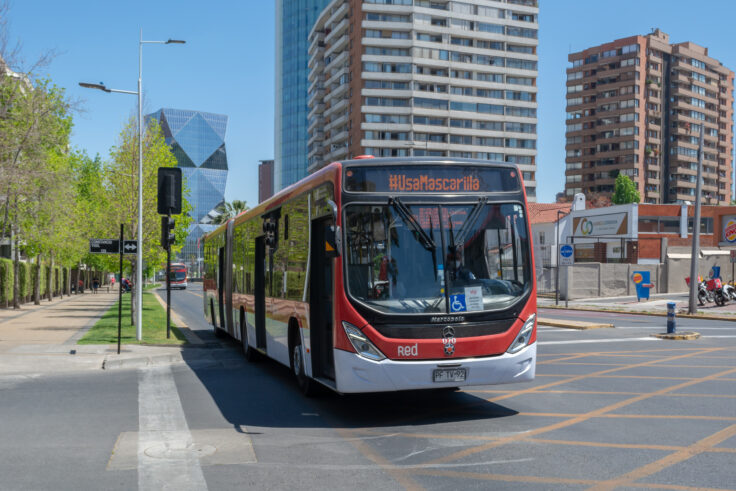
In 2024, ITDP Mexico, in collaboration with the UC Center for Sustainable Urban Development (CEDEUS) and BRT+ Center of Excellence, updated the Visualizer to include cities in the country of Chile.The tool now includes, in addition to data on the original 20 Mexican cities and 1 city in Costa Rica, visualizations for 17 major urban areas across Chile. This new data helps users identify opportunities for improving access to healthcare, education, employment, and leisure destinations for millions of people living in the metro areas of Chile. With this information, it is possible for users to analyze the existing state of mobility and access in a city, compare it between countries, and ultimately make more informed decisions.

Better data on mobility and access can help cities make evidence-based decisions and create opportunities to promote sustainable, equitable, and inclusive mobility. Visit ITDP’s Atlas of Sustainable Transport for more details on access in cities all around the world.
