July 01, 2025
CyclingMAX and the Case for Active Mobility
As cities around the world face growing traffic congestion, rising emissions, and strained transport budgets, the case for investing in cycling and walking infrastructure has never been more apparent or urgent.
Discover more of ITDP’s cycling-related content and resources.
Urban mobility is at a turning point. Car ownership is on the rise, but it comes at a steep cost, both financially and environmentally. Unless this trend is reversed, global transport emissions are projected to rise by 33% by 2050. Meanwhile, systems based on walking, cycling, and transit are 50% more affordable than car-centric ones while also being fundamentally healthier, greener, and more inclusive.
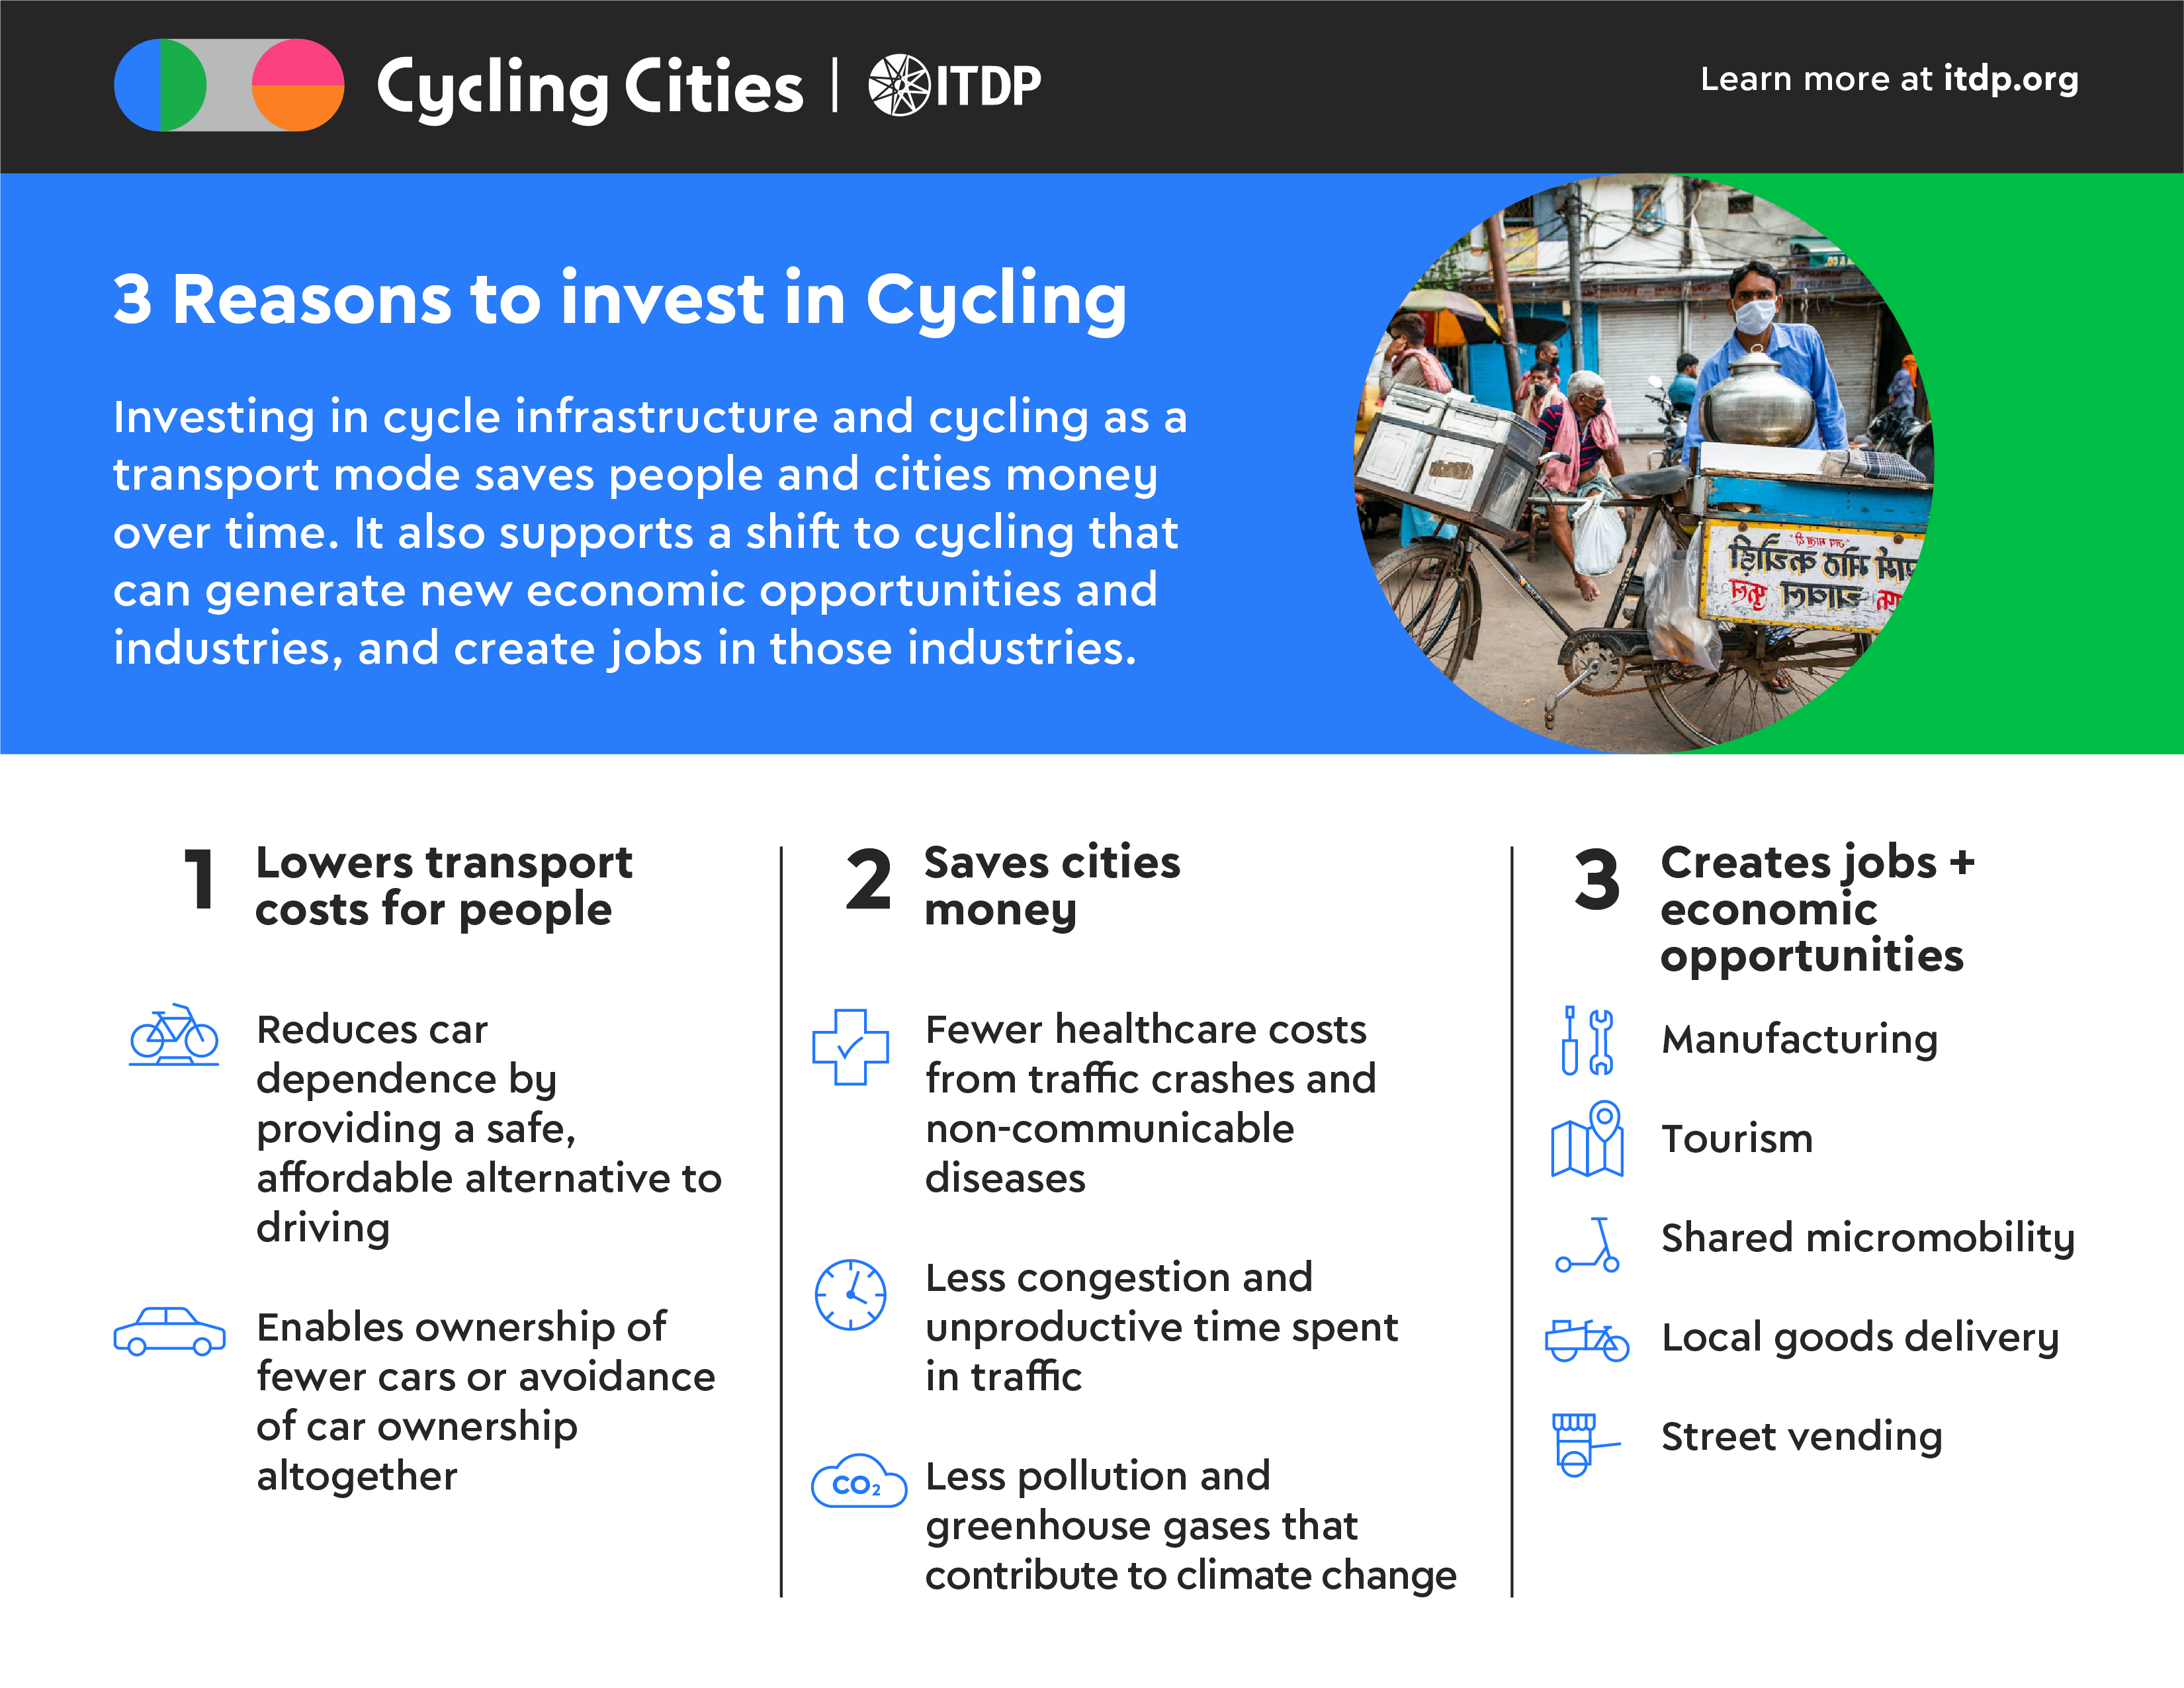
There is a growing amount of evidence supporting the economic and climate benefits of these mobility investments, including ITDP’s research and advocacy through the Cycling Cities campaign. Data from reports, such as Making the Economic Case for Walking and Cycling and Protected Bicycle Lanes Protect the Climate, further helps to strengthen the case for the widespread benefits of investing in urban active mobility networks.
In 2023, the joint World Bank and ITDP report, The Path Less Travelled: Scaling Up Active Mobility to Capture Economic and Climate Benefits, notably identified a significant barrier to scaling up investments in active mobility projects — the lack of a standardized cost-benefit analysis methodology. To address this gap, a tool was released in 2025 by the World Bank and ITDP, designed to help decision-makers turn their research and evidence for active mobility projects into actionable insights.
This tool, known as CyclingMAX, is a first-of-its-kind web-based platform that enables users, especially in low- and middle-income countries (LMICs), to quickly assess the value and benefits of a planned cycle infrastructure network.
Requiring just a few project-specific inputs, CyclingMAX enables users to understand the potential economic impacts of an early-stage cycle network project. The tool calculates two key indicators that provide clear, quantifiable, and comparable estimates of investment value:
- Net Present Value (NPV): The sum of the present values of incoming and outgoing cash flows over a set evaluation period. A positive NPV indicates that a project is economically viable.
- Internal rate of return (IRR): The rate at which an investment grows. Development banks tend to look for IRRs between 12% and 20% to move a project forward to financing.
These indicators enable the “apples-to-apples” comparison across different types of investments and regions that had previously left gaps in urban cycling research. More broadly, CyclingMAX empowers users to compare the returns on cycling infrastructure investments with those of other transportation investments, such as bus rapid transit (BRT) systems, roadways, or other infrastructure, thereby strengthening the economic case for active mobility.
With CyclingMAX, cities now have the tools they need to act. Governments and planners can better justify investments in cycling infrastructure and unlock funding for scalable implementation. CyclingMAX also provides the annual value of the project’s impact on traffic crashes, mortalities, greenhouse gas emissions, and travel time. The companion report highlights several applications of the tool in major cities ranging from Lima, Peru, to Addis Ababa, Ethiopia, to São Paulo, Brazil. Across all eight city case study projects evaluated in the report, cycling investments demonstrated significant returns (see details below).
Eight major cities were evaluated with the CyclingMAX tool to assess the return on investment in urban cycling networks.
| City and Country | Investment in $US | EIRR (20% considered very attractive) | NPV in $US (Positive value indicates economic viability) |
| Abidjan, Cote d’Ivoire | $6 million | 123.5% | $52 million |
| Dodoma, Tanzania | $27 million | 41.6% | $60 million |
| Kampala, Uganda | $131 million | 55.8% | $1.08 billion |
| Addis Ababa, Ethiopia | $118 million | 75.7% | $689 million |
| Lima, Peru | $17.4 million | 85.7% | $144 million |
| São Paulo, Brazil | $18.7 million | 88.6% | $156 million |
| Itajaí, Brazil | $37 million | 44.3% | $148 million |
| Recife, Brazil | $55.5 million | 91.5% | $594 million |
CyclingMAX has helped demonstrate that investing in robust active mobility infrastructure within low and middle-income cities offers multiple quantifiable benefits for economic vitality, public health, and climate action. Often, governments are the ones funding active mobility infrastructure, as these projects tend to be too small to take on debt to finance externally. In some cases, cycle lane networks are included in larger financing packages.
Either way, more governments and institutions must recognize the economic potential that cycle lane networks generate, as well as the numerous social and environmental benefits that come with increasing access to sustainable and affordable mobility options. We can no longer afford to continue patterns of urban development centered on private vehicles, expansive roads, and fossil fuels, which harm our health and the environment, contribute to congestion, and hinder economic growth.

As we enter the 2026-2035 UN Decade of Action for Sustainable Transport, which will highlight the essential role of greener transportation worldwide, tools like CyclingMAX will be crucial in laying a foundation for planners and policymakers seeking to transform their streets.